Across the aviation industry, labor costs continue to rise as firms fight to claim skilled workers in a tight market. Many MROs, operators, and maintainers are clamoring to hire from a reduced workforce. As companies seek the best candidates for their open roles, rising candidate salary and benefits expectations drive labor costs.
What is leading to increased labor costs? One factor may be simple supply-and-demand — a lack of skilled mechanics ready to meet the needs of the rebounding industry along with more competition for each potential hire.
Other reasons may be lifestyle-related. Many workers prefer to remain in their current role in a time of economic uncertainty, while those who have decided to change jobs take advantage of the talent-driven market.
A significant consideration when adding a new employee is always wages. Data comparing the average salary of aircraft mechanics and technicians across varying regions can help employers and employees decide what is an attractive salary for a role.
Let’s take a closer look at the data related to aircraft mechanics’ and technicians’ salaries by state and explore how companies can better position themselves to attract and retain talent.
Aircraft Mechanic and Technician Salaries: The Data
In a study of regional salaries, ZipRecruiter and ADP collated salary data for aircraft mechanics and technicians for each state.
The data reveals the breakdown of average salaries for aircraft mechanics and technicians in various metropolitan statistical areas (MSAs) across the United States. Using this, we can determine the states with the highest and lowest average salaries.
A&P Aircraft Mechanic
The research finds that the national average of salaries for A&P Aircraft Mechanics is as follows:
- National Average: $51,059 ($24.55/Hour)
- Bottom 25th Percentile: $42,000 ($20.19/Hour)
- Top 90th Percentile: $69,000 ($33.17/Hour)
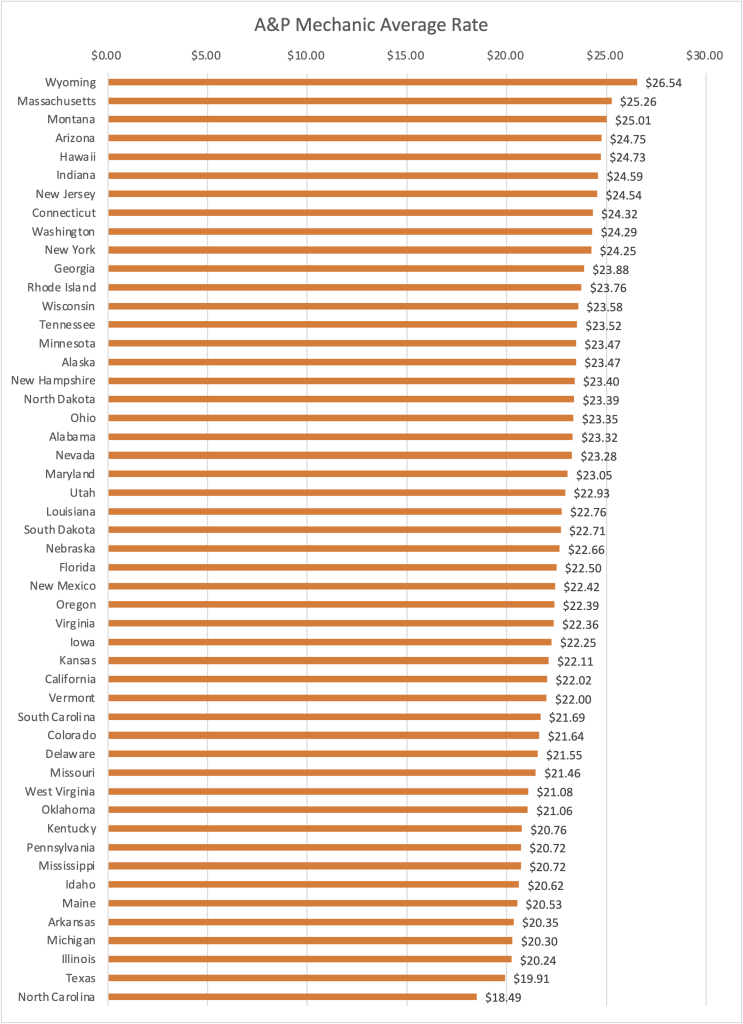
When broken down by state, the data reveals that the highest average salary is found in Wyoming. The top five average salaries include geographically diverse states across the country, ranging from Hawaii to Massachusetts.
Top 5 A&P Salaries by State
1. Wyoming: $55,201 ($26.54/hour)
2. Massachusetts $52,532 ($25.26/hour)
3. Montana: $52,016 ($25.01/hour)
4. Arizona: $51,481 ($24.75/hour)
5. Hawaii: $51,438 ($24.73/hour)
Bottom 5 A&P Salaries by State
46. Arkansas: $42,324 ($20.35/hour)
47. Michigan: $42,233 ($20.30/hour)
48. Illinois: $42,085 ($20.24/hour)
49. Texas: $41,406 ($19.91/hour)
50. North Carolina: $38,451 ($18.49/hour)
The data demonstrates that Wyoming and Massachusetts have the highest average salaries for aircraft mechanics and technicians, while North Carolina and Texas are the lowest. There is a 44% difference between the average salary in the lowest state to the highest.
Avionics Technician
A review of Avionics Technician data finds that the average national salaries are as follows:
- National Average: $57,015 ($27.41/hour)
- Bottom 25th Percentile: $50,500 ($24.28/hour)
- Top 90th Percentile: $70,000 ($33.65/hour)
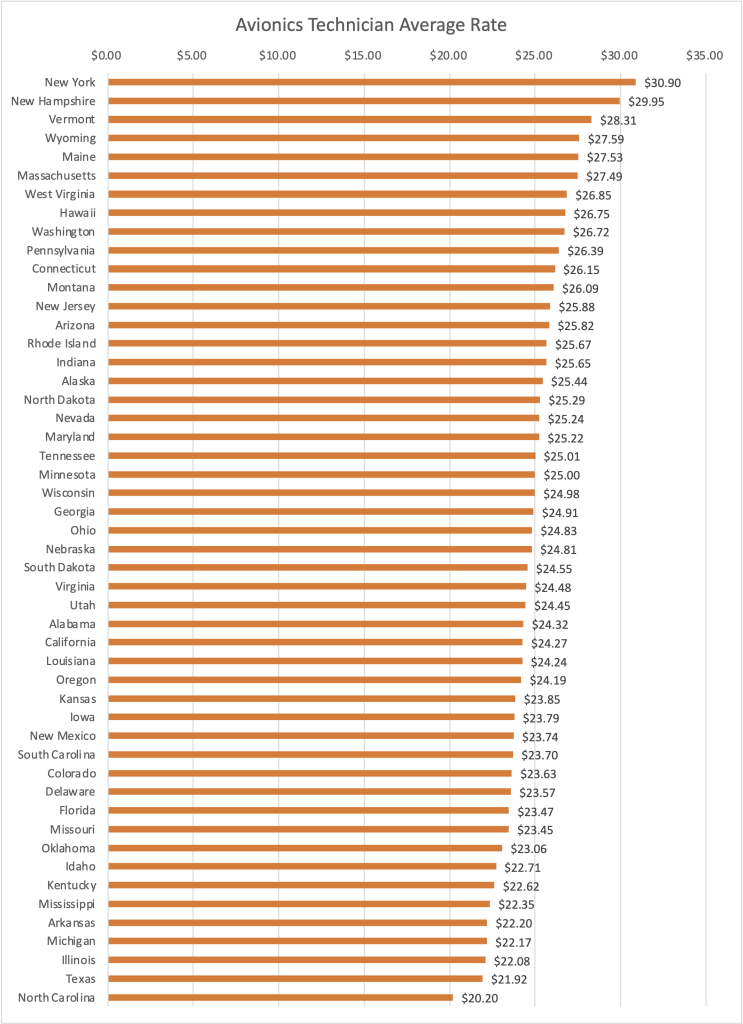
For state salaries, the study finds that the location for highest paid positions for Avionics Technician are mostly in the Northeast US, while the lowest average salaries vary geographically:
Top 5 Avionics Technician Salaries by State
1. New York: $64,268 ($30.90/hour)
2. New Hampshire: $62,301 ($29.95/hour)
3. Vermont: $58,890 ($28.31/hour)
4. Wyoming: $57,381 ($27.59/hour)
5. Maine: $57,269 ($27.53/hour)
Bottom 5 Avionics Technician Salaries by State
46. Arkansas: $46,173 ($22.22/hour)
47. Michigan: $46,117 ($22.17/hour)
48. Illinois: $45,922 ($22.08/hour)
49. Texas: $45,584 ($21.92/hour)
50. North Carolina: $42,015 ($20.20/hour)
There is a significant difference in average salary by state, with a 53% increase in the average salary from the lowest state to the highest. This means avionics technicians in New York are, on average, paid over 50% more than technicians in North Carolina.
Aircraft Maintenance Manager
As expected, maintenance managers have higher average salaries than mechanics. However, on average, the pay increase from mechanic to manager is not as significant as may be expected. The study finds that managers typically require a minimum of two years of experience as a mechanic before leading a team — although most managers have significantly more experience than the minimum.
Salary studies find that the average salaries for Aviation Maintenance Managers are as follows:
- National Average: $64,435 ($30.98/hour)
- Bottom 25th Percentile: $42,000 ($20.19/hour)
- Top 90th Percentile: $97,500 ($46.87/hour)
Notably, the pay range for Maintenance Managers is quite large.
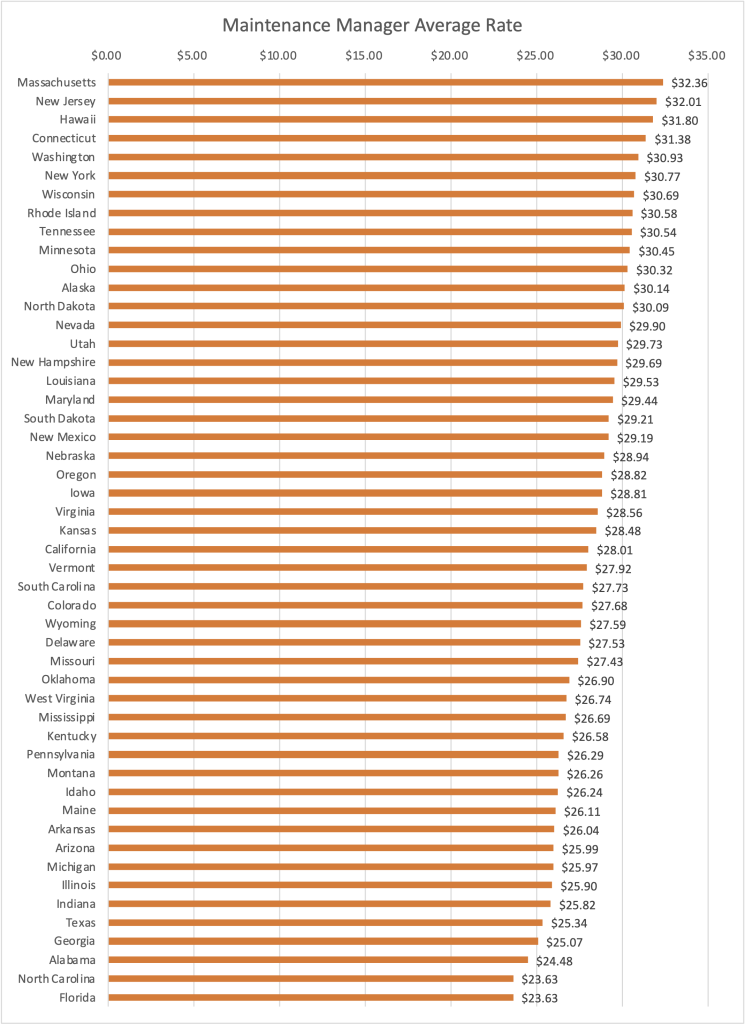
Top 5 Aircraft Maintenance Manager Salaries by State
1. Massachusetts: $67,306 ($32.36/hour)
2. New Jersey: $66,591 ($32.01/hour)
3. Hawaii: $66,144 ($31.80/hour)
4. Connecticut: $65,281 ($41.38/hour)
5. Washington: $64,336 ($30.93/hour)
Bottom 5 Aircraft Maintenance Manager Salaries by State
46. Texas: $52,700 ($25.34/hour)
47. Georgia: $52,144 ($25.07/hour)
48. Alabama: $50,924 ($24.48/hour)
49. North Carolina: $49,157 ($23.62/hour)
50. Florida: $49,146 ($23.63/hour)
For maintenance managers, the highest salaries are located across the Northeast but also include Hawaii and Washington. The data shows lower pay ranges for states in the south, with a 37% difference in pay from top to bottom.
Interestingly, the data shows only a 13% increase from the average salary for a mechanic to the average salary for a maintenance manager. We expected the pay difference between the two roles to be more considerable. We are not certain of the exact reasons for the minimal pay increase when leading a team. Causes may include mechanics that identify themselves as managers in their job title, team leads that are essentially performing the duties of a mechanic with a few added tasks, or simply a wide variety in what employers are willing to pay for management roles.
How To Use The Data to Drive Recruitment
While the data shows that pay rates vary based on location, there are obvious exceptions to these averages based on specialized training and other factors. The increased pay range, rather than the average pay, account for these exceptions.
The data should give you a ballpark idea of what mechanic and technician roles pay on average and how wages vary across the United States. It provides a starting point for setting labor rates that can help lure the best candidates to your openings.
Consider the job and the current talent market when setting a target compensation rate. Location, position, work conditions, and responsibilities should all play a factor in setting target rates.
The current flux in pay rates may force you to set target compensations based on the current market and not on what you historically paid for a role. Although there are many factors involved, compensation remains a vital tool used to attract top talent.
Candidates Are In The Driver’s Seat
Ultimately, the data presented here are averages. The final deciding factor on who fills open positions is the candidates themselves. Every hiring conversation in today’s market will be a negotiation. Candidates will take far more than just the job and salary into account. Companies that can offer a great candidate experience along with a competitive pay rate will be the ones who fill their open roles.
By equipping yourself with the most current salary data, you are better prepared to make your jobs more enticing to new team members.